Posts
The 2026 employer brand benchmark report


See other posts from by Bryan Adams
CEO
Let's be frank. In 2026, your careers website is either making money or losing it. There is no middle ground. Companies with strong employer brands get 2x the applicants and 50% more qualified candidates, cut cost-per-hire in half, and drop turnover by 28%. The ones that don't? They're watching their best people walk into a competitor's offer.
Here's the brutal bit. 92% of candidates who click Apply never finish the application. The click-to-apply average across industries sits at 6%. Top performers hit 10% and above. That's not a rounding error, that's a different business.
Candidates aren't being difficult. They're being human. They're on their phones (89% of job seekers use mobile to hunt for jobs), they're comparing you to every consumer brand they've ever loved, and they're abandoning you in under five minutes when the experience drags. Candidate experience isn't a brand exercise anymore. It's a performance asset.
This report lays out what's actually working in 2026. The industry averages, the honest gaps, and the plays we've seen move the needle for brands like Domino's, General Motors, Canva, and Caterpillar. We'll show you where the money is leaking. Then we'll show you how to plug it.
The state of employer brand in 2026
What's actually changed
The employment market has reset. Post-pandemic. Post-AI boom. Post-layoff cycles. Candidates are doing more research than ever, they're choosier than ever, and they're less forgiving of a bad experience. Three shifts are defining this year.
1. Candidates research before they apply
83% of job seekers research company reviews before applying. Glassdoor, Indeed, LinkedIn, Blind, Reddit. That's your extended employer brand whether you like it or not. You don't control the narrative in those rooms. But you do control whether the story being told is written by your best people or by the ones who left angry.
And the stakes are real: 69% of candidates will reject a job from a company with a weak employer brand, even if they're unemployed. Think about that. Someone who needs the paycheck will still walk away. That's the power and the liability of brand.
2. Experience is the whole game
The gap between what candidates expect and what most sites deliver is embarrassing. Candidates want frictionless apply flows, clear role information, mobile-first journeys, and a site that loads before they lose interest. 40% of applications are abandoned before submission. That's not a UX blip, that's a direct pipeline leak.
The math is blunt: applications under five minutes hit 12.5% completion. Applications over fifteen minutes drop to 3.6%. That's a 3x swing driven entirely by how much of the candidate's time you're willing to waste. Most organizations are still running 20+ question forms because their ATS asked for it. Candidates don't care. They close the tab.
3. Data-driven talent strategy is table stakes
The brands winning on talent this year are measuring everything. Conversion by stage. Abandonment by form field. Time-to-hire by role. They're A/B testing job descriptions the same way they test paid media. They're connecting careers site performance directly to cost-per-hire. They're not guessing. They're compounding.
The opportunity
Here's the flip side. The same 69% rejection statistic that keeps TA leaders up at night is also the single biggest competitive lever in talent acquisition. Brands that build and communicate a strong employer brand, and back it up with a careers site that actually performs, see measurable ROI across hiring, retention, and quality.
A 50% reduction in cost-per-hire is not a marketing claim, it's a P&L event. A company hiring 500 people a year at an average £4,000 cost-per-hire is sitting on £1M of annual savings waiting to be captured. The 2026 benchmark reveals who's capturing it and who's leaving it on the table.
Careers website performance benchmarks
The conversion reality
Your careers website isn't a brochure. It's a conversion asset. And the data says most of them are underperforming badly.
Click-to-apply conversion averaged 6% across industries in 2024. For every 100 candidates who click a role, 94 don't apply. Some of that is natural, not all of it is fixable, but a lot of it is. The spread tells the story.
- Industry average: 6% click-to-apply conversion
- Top performers: 10% and above
- High performers by end of 2024: 6.1%, up 35% year-over-year on the back of UX improvements alone
Move from 6% to 10% and you've increased your pipeline by 67% without spending a pound on job board advertising. That's not theoretical. That's what the top decile is doing right now.
Application abandonment: the silent pipeline leak
40%+ of applications are abandoned before submission. Where does the leak happen?
- Form length. Applications over 15 minutes collapse to 3.6% completion vs 12.5% under five minutes
- Mobile friction. 89% of job seekers hunt on mobile. Most careers sites are desktop designs squeezed into a phone
- Unclear role expectations. Candidates leave when they can't quickly assess fit
- Technical drag. Form errors, load times over three seconds, and broken Apply buttons. Google's own performance guidance is blunt: every second of load time costs you conversions
The brands addressing this properly are cutting abandonment by half, lifting completion 35% year-over-year, and pushing conversion past 10%. None of it is magic. All of it is discipline.
Why careers sites drive quality, not quantity
Here's a counterintuitive truth. Your careers website doesn't generate the most applicants, but it generates the most qualified ones. According to Gartner, careers websites account for 60% of total applications at well-run organisations. Job boards produce the volume. Your careers site produces the hires.
Candidates arriving at your careers website have already self-selected. They've decided they're interested in you specifically. They're not comparison-shopping 10 roles. They're asking one question: does this fit? That makes them a different candidate. More engaged. More likely to succeed. More worth optimizing for.
Industry benchmarks (2024-2025 data)
| Metric | Low performer | Industry average | High performer | Notes |
|---|---|---|---|---|
| Click-to-apply conversion | 3-4% | 6% | 10%+ | CareerPlug, 2024 |
| Application abandonment | 50%+ | 40%+ | 15-20% | Withe, 2024 |
| Time-to-apply | 12+ mins | 8-10 mins | 3-5 mins | Sub-5 min wins 3x completion |
| Mobile optimization | Basic | Partial | Full | 89% apply on mobile |
| Careers page traffic conversion | 2-3% | 5-6% | 10%+ | Top decile |
| JD clarity score | Low | Medium | High | Candidate-first language |
Employer brand ROI, the business case
The math that matters
Employer brand impact isn't abstract. It's P&L.
Cost-per-hire: 50% reduction territory
Strong employer brands reduce cost-per-hire by 50%. In practice that means:
- Less spend on job board placements and recruiter hours
- Better self-selection, so fewer wasted interview cycles on unfit candidates
- A fuller pipeline (2x applicants, 50% more qualified) that reduces sourcing cost per hire
- Fewer offer declines, fewer counteroffers, fewer renegotiations
For a 500-person-per-year hiring company at an average £4,000 cost-per-hire, a 50% reduction is £1M annually. For enterprises at 2,000-5,000 hires a year, the number gets uncomfortable to ignore.
Turnover: 28% reduction territory
Strong employer brands cut turnover by 28%. Retention compounds. Every departure costs 50-200% of salary to replace. A 500-person organization avoiding 140 departures a year, at £40k average salary and a 100% replacement multiplier, is looking at £5.6M in avoided cost.
For most organizations, employer brand is a bigger lever on hiring and retention cost than anything else in the talent playbook. Bigger than sourcing tech. Bigger than referral bonuses. Bigger than employer rating campaigns that don't match reality.
Where the money leaks
Without intentional employer brand strategy, three leaks compound.
1. Cost-per-hire inflation. Weak brand means fewer quality inbound candidates. Recruiters spend more time sourcing, screening, and convincing. Offers require richer packages. Time-to-hire stretches. Multiplied across 500 hires, that's a £500k to £1M annual tax you didn't budget for.
2. Turnover acceleration. New hires join mismatched to the culture they were sold. Onboarding doesn't reinforce the brand promise. The gap between what they heard and what they live becomes obvious in month three. They leave in month nine. You pay twice.
3. Ecosystem damage. Departing employees become detractors. Reviews turn negative. Referrals dry up. Word-of-mouth compounds. A company that hired easily in 2023 can find itself struggling in 2026, not because the market changed but because the story about working there changed and nobody noticed.
The benchmark: who's winning
Top performers investing deliberately in employer brand and careers site performance are seeing:
- Cost-per-hire 40-50% below industry average
- Time-to-hire 15-20% faster than peers
- 12-month retention 25-30% higher
- Offer acceptance 85%+ vs 70-75% average
- Candidate satisfaction 8.5+/10 in post-apply surveys
These aren't outliers. These are the returns on doing the work.
Talent attraction benchmarks by industry
Industry-specific conversion and talent metrics
Different industries attract different talent, face different competition, and convert at different rates. Here's what the 2026 benchmarks look like by sector.
| Industry | Avg CTA conv. | High performer conv. | Time-to-hire (days) | Talent availability | Key retention challenge |
|---|---|---|---|---|---|
| Technology | 5-7% | 12-15% | 32-42 | Low | Career progression clarity |
| Financial services | 6-8% | 10-12% | 28-35 | Medium | Compensation competition |
| Healthcare | 4-6% | 8-10% | 40-60 | Critical shortage | Work-life balance |
| Retail and hospitality | 3-5% | 7-9% | 14-21 | Medium-high | Manager quality |
| Manufacturing and logistics | 4-6% | 9-11% | 35-45 | Medium | Safety and advancement |
| Professional services | 7-9% | 13-16% | 30-40 | Medium | Work-life balance |
| Education | 5-7% | 10-12% | 40-50 | Low | Mission messaging |
| Energy and utilities | 6-8% | 11-13% | 35-45 | Low | Sustainability narrative |
Key insights by sector
Technology. Highest baseline volume, fiercest competition. Tech conversion leaders aren't the biggest names, they're the clearest about what the role actually is and where it leads. Engineering culture, growth opportunity, and authentic team storytelling outperform glossy brand work every time.
Healthcare. Tightest labour market of the lot. Conversion sits at 4-6% because talent is scarce, not because the sites are broken. Winners lean hard into mission, flexibility, and support systems. This is the sector where employer brand messaging matters most, and generic doesn't cut it.
Financial services. Talent is available but careful. Conversion leaders differentiate on client impact, technical challenge, and path to senior roles. Generic we're-a-great-place-to-work messaging underperforms at scale.
Retail and hospitality. Highest baseline volume, lowest conversion. Winners obsess over store-level culture, manager quality, and hourly wage transparency. Speed and mobile are non-negotiable. See our work with Domino's for what this looks like executed at scale: 1,800 applications a day, a 62% year-over-year application increase, and page load times cut from 23 seconds to 2.6.
Your industry benchmarks
Sector averages are useful context. They're not a strategy. To position your actual performance against your actual competitors, we recommend four things:
- Define your direct competitor set. The three to five organisations you're really competing with for talent
- Audit their careers sites. Funnel, form length, mobile experience, JD quality
- Benchmark your own metrics. Apply rate, abandonment, time-to-hire, offer acceptance
- Identify the gaps. Where you're losing candidates and at which stage
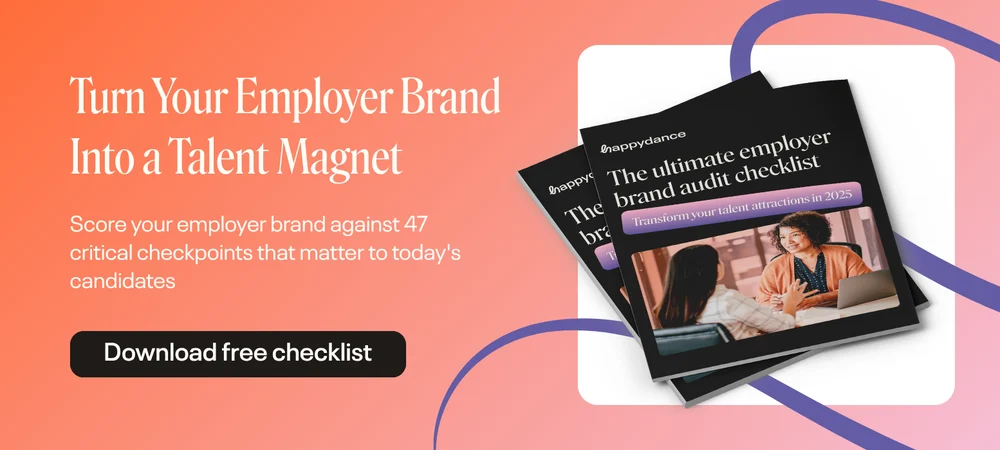
If you want a second set of eyes on your site, book a free careers site audit. We'll tell you honestly where the leaks are.
The candidate experience gap
What candidates want vs what employers deliver
There's a systematic gap between candidate expectations in 2026 and what most careers sites serve up.
What candidates expect:
- Speed. Apply in under five minutes, not twenty. Feedback in 48 hours. Clear status updates
- Transparency. Role expectations, team dynamics, compensation range, career path
- Mobile first. Because that's where they are
- Personalization. Roles that fit their skills, not a generic job list
- Authenticity. Real stories from real employees, not stock photography and mission statements
What most organizations deliver:
- Long forms asking for information already on the resume
- Desktop-first design that breaks on a phone
- Generic culture messaging and stock imagery
- JDs that are 500 words of requirements with no sense of team or manager
- Two-week hiring silences
- Zero transparency on compensation or progression
The gap isn't subtle. It's why abandonment sits at 40%+, conversion at 6%, and top performers clear 10% by simply closing it.
The candidate journey: where it actually breaks
Stage 1: Awareness. Candidates are researching you on Glassdoor, LinkedIn, Reddit, and Indeed. The break point is negative reviews and mismatched social proof. Winners run proactive employer brand programmes and equip current employees to share authentic experiences.
Stage 2: Consideration. Candidates visit the careers site and assess fit. Breaks happen with poorly written JDs, no sense of the team, and unclear career paths. Winners write job descriptions from the candidate's perspective, feature employee spotlights, and make progression explicit.
Stage 3: Application. Candidate starts the form. Long forms, redundant fields, broken mobile flow, all of it kills conversion. Winners run 3-5 minute applications, auto-populate where possible, and test relentlessly.
Stage 4: Submission. Candidate finishes (if they finish). Breaks are form errors, no confirmation, no sense of next steps. Winners send instant confirmations with a clear timeline and a human name attached.
Stage 5: Response. Candidate waits. Breaks are silence, two-week gaps, unclear status. Winners automate status updates, communicate timelines honestly, and add personal touches from hiring managers.
The experience imperative
Every candidate interaction is a brand moment. A candidate who applies, has a great experience, and doesn't get hired is still a brand ambassador. Or a detractor. You choose which. Top performers treat every candidate like a customer, and it shows in their conversion rates, their offer acceptance, and the reviews they don't have to apologise for.
Speed, performance, and the service behind them
Speed is the whole hook
Candidate experience is built on speed. Not style, not animation, not clever copy. Google's own performance guidance is clear: every second of load time you add, you lose candidates. Every second you trim, you gain them.
Here's what that looks like in the real world. Our own Inside Track analysis of 101 live careers sites, measured with Lighthouse and Google PageSpeed Insights over five weeks in Q2 2025, found the following:
- Happydance Speed Index scores reach 99/100 (Wells Fargo, Sage, Rocket, Equifax)
- Fastest Happydance desktop load: 0.7 seconds (Luno, Blip)
- Average Happydance total Speed Index across all devices: 3.1 seconds
- Average Happydance mobile load: 4.7 seconds. Industry competitor average: 10.35 seconds. More than 2x faster
- Domino's: page load improved from 23 seconds to 2.6 seconds after migration. 1,800 applications a day. 62% year-over-year application increase. 51% improvement in mobile utilisation
Sites with mobile Speed Index scores above 90 (Sage, SpartanNash, Rocket) also maintain consistently low bounce and high engagement. Speed isn't a vanity metric. It's the foundation every other metric stands on.
The common speed killers
When a careers website is slow, it's almost always one of nine things. We see these in audit after audit.
- Too many HTTP requests, calling external files that don't need to be there
- Sluggish server response delaying every downstream element
- No CDN, so assets can't cache efficiently across geographies
- Bloated JavaScript and CSS files
- Unused scripts loading anyway and wasting bandwidth
- Heavy third-party scripts with no optimisation
- Oversized images or videos
- Missing image dimensions, forcing layout shifts
- MP4 video where modern streaming formats would cut weight in half
None of these are exotic. All of them are fixable. And most careers site platforms don't fix them because their architecture won't let them.
Service is the part nobody talks about
Speed is the outcome. Service is what keeps the speed. This is where most enterprise platforms fall down, and where the real QBR conversations land.
The enterprise platform pattern is familiar. Big name sale. Long implementation (industry standard is six to nine months). Then the service model shifts from dedicated success managers to ticket queues. Verified customer reviews of the leading enterprise careers site platforms describe average ticket resolution times of around three weeks. Small content changes become support cases. Edits become invoices. Candidate experience becomes an internal ticket backlog.
That's not a customer experience problem for the TA team. That's a candidate experience problem for the business. Because while the ticket sits in a queue, the outdated copy stays live, the broken Apply button stays broken, and candidates keep leaving.
How Happydance does it differently
Three things that matter, borne out in our recent customer reviews.
Proprietary CMS, no tickets for changes. Our customers update their own content in real time. No raising tickets, no waiting. General Motors reduced careers site admin by 30+ hours per month just by moving off their previous platform and onto ours. That's a half-time job returned to the TA team.
Concierge services, not ticket queues. When customers do want hands-on help, they get a team, not a ticket number. SEO concierge, CRO concierge, Insights concierge, Creative concierge, and Support concierge. Real people. Named. Accountable.
Implementation in 2 to 4 months, not 6 to 9. Most enterprise careers website implementations take six to nine months. Ours take two to four. That's not a minor efficiency gain. That's two to five months of better candidate experience in the market, producing hires.
The Loop: how we measure what matters
We don't hand customers a dashboard and wish them luck. Our QBR framework, which customers call The Loop, tracks brand experience, content quality, engagement, and technical performance against a baseline set at launch. Scroll depth, time on site, CTA click-through, conversion, page load, mobile split, heat maps, and device usage. Each one is benchmarked. Each one moves, or we find out why.
Customers running Happydance see 25% average traffic lift, 75%+ session increase year-over-year, and up to 25% improvement in application conversion. One named customer saw a 61% organic traffic increase, a 68% bounce rate reduction, and 220% more time on site. These are our internal platform averages, not industry guesses.
AI and the future of recruitment marketing
What's working in 2026
AI has moved from emerging technology to operational necessity. The brands leading on conversion and employer brand are using it in three specific ways. None of them involve replacing recruiters.
1. Job description optimization. AI isn't writing your JDs. It's making them better. Top performers use AI to analyse language patterns that drive clicks, strip jargon, optimise for search relevance, and A/B test title and description variations. The result: 15-20% improvement in click-through rate without changing the role itself.
2. Candidate matching and routing. Advanced platforms are moving beyond keyword matching to real skill and culture-fit assessment. Candidates get routed to roles that fit them, including ones they didn't apply to. Qualified candidate volume climbs 25-30%. Time-to-hire drops because matches are pre-qualified.
3. Conversion optimization and personalization. Smart careers sites personalise role recommendations based on profile and behaviour. They optimize CTAs dynamically. They predict abandonment risk and intervene with targeted messaging. They auto-populate fields where possible. Conversion rates lift 10-15% from intelligent friction reduction alone.
The reality check
AI isn't a silver bullet. The brands seeing real ROI are pairing it with four things:
- A strong employer brand foundation. AI amplifies what you have, it doesn't fix a broken story
- Clean data. Garbage in, garbage out, permanently
- A human-centred hiring philosophy. AI augments recruiter judgment, it doesn't replace it
- A continuous optimisation mindset. Set up, measure, iterate. Never fire-and-forget
Brands that treat AI as a checkbox get disappointed. Brands that treat it as a competitive lever, integrated into hiring strategy, employer brand, and talent experience, win.
The 2026 action framework
What top performers are doing
The top 10% of organisations by hiring efficiency and employer brand perception share ten practices. None of it is complicated. All of it is discipline.
- They measure everything. Conversion by stage, abandonment by form field, time-to-hire by role, offer acceptance, satisfaction, brand perception. Monthly review, not annual
- They obsess over the application experience. 3-5 minute forms. Flawless mobile. Abandonment under 20%
- They tell authentic employer brand stories. Real employee spotlights, team videos, real culture insights. Candidates can see themselves
- They're transparent. Compensation ranges are public or shared early. Career paths are explicit. Fit is obvious
- They invest in recruiting operations. Hiring managers are trained. Recruiters have real tools. The process is standardised but flexible
- They optimize JDs relentlessly. Written for candidates, not for internal approval
- They own candidate communication. Automatic status updates. Fast responses. Thoughtful rejections. Nobody wondering where they stand
- They use data to prevent attrition. Culture reinforcement in onboarding. Career progression discussed in month one. Engagement measured
- They leverage AI strategically. Embedded, not bolted on
- They test and iterate constantly. A/B tests on copy, fields, subject lines. What works scales. What doesn't dies
Your 90-day action plan
Phase 1: Measure (weeks 1-2)
Before you change anything, understand your baseline.
- Careers site audit. How many candidates visit? What's your click-to-apply rate? Where's abandonment happening? If you don't have this data, start with our free audit checklist
- Application funnel analysis. Track every stage from click to hire. Identify the biggest bottleneck
- Employer brand assessment. Have 20 recent applicants and hires rate your employer brand 1-10. Ask why. Listen
- Competitor benchmarking. Audit three competitor careers sites. Time yourself applying. Note friction. Identify gaps
Deliverable: baseline metrics dashboard showing current performance.
Phase 2: Prioritise (weeks 3-4)
Not everything needs to change at once. Some fixes yield 5x ROI, others 5%.
- Quick wins. Where can you fix the biggest friction with the smallest effort?
- High-impact initiatives. What moves the needle most?
- Resource assessment. Budget, timeline, team capacity
Deliverable: prioritised roadmap with quick wins (0-30 days), medium-term (30-90), and longer-term strategy.
Phase 3: Execute (weeks 5-12)
Start with quick wins to build momentum. Then layer in bigger initiatives.
Quick wins (0-30 days):
- Reduce the application form to five minutes. Cut anything the resume already covers
- Audit JDs for clarity. Strip jargon
- Ship mobile-first design on the careers page
- Set up automated candidate status updates
- Launch employee spotlight content. Three to five short videos or written profiles
Medium-term (30-90 days):
- Implement careers site conversion analytics if you haven't already
- Run A/B tests on titles, descriptions, and CTAs
- Develop the employer brand narrative. Why should candidates care?
- Train hiring managers on candidate communication standards
- Implement AI-powered JD optimisation where budget allows
Long-term (90 days and beyond):
- Build a personalised careers site experience
- Implement predictive analytics for time-to-hire and quality-of-hire
- Develop role-specific onboarding that reinforces the brand
- Establish continuous testing and optimisation as an ongoing practice
Measuring success
By the end of Q2 2026, you should see movement across five dimensions.
- Quick wins. Form time down 30-40%. Mobile experience optimized. Candidate satisfaction up 20%+
- Pipeline. Click-to-apply up to 8-9%. Abandonment down to 25-30%
- Hiring. Time-to-hire down 15-20%. Offer acceptance up 5-10%
- Employer brand. Rating up 10-15%. Referral rate up. Negative review volume down
- Financial. Cost-per-hire down 10-20%. Recruiting spend efficiency up
These are realistic. Organizations executing this framework are hitting these numbers.
The ongoing commitment
Employer brand and careers website optimization isn't a project, it's a practice. Top performers review conversion metrics monthly, test continuously, gather candidate feedback quarterly, benchmark against competitors annually, adjust messaging as the market shifts, and invest in new technology as it emerges. The brands that build this muscle are the ones that win on talent for the rest of the decade.
Getting started with Happydance
How we help
If this report has made one thing clear, it's that careers site performance and employer brand are now inseparable from hiring outcomes. You need to measure, optimize, and iterate on both. That's what Happydance does.
We're a careers site and recruitment marketing platform built for modern talent teams. What's in the box:
- Conversion-optimized careers website. Purpose-built for speed, mobile, and candidate personalization
- Built-in AI and SEO tools, including optimisation for generative search
- Employer brand storytelling platform for authentic employee content
- Analytics and insights. Deep data on what's working and where candidates are dropping off
- ATS integration. Seamless handoff into your recruiting process
- Concierge services across SEO, CRO, insights, creative, and support
What our customers see
These are our internal platform averages, not industry claims:
- 25% average traffic increase after implementation
- 75%+ session increase year-over-year
- Up to 25% improvement in application conversion rates
- Up to 50% increase in pageviews year-over-year
- Domino's: 1,800 applications a day, 62% year-over-year application growth, page load from 23 seconds to 2.6
- General Motors: 30+ hours of admin time returned monthly
- One named customer: 61% organic traffic increase, 68% bounce rate reduction, 220% increase in time on site
Next steps
- See it live. Spend an hour with us and we'll show you how your careers website could convert better and where the friction is right now
- Explore customer stories from brands we've helped transform hiring
- Get the free careers site audit checklist if you want to self-diagnose before you talk to anyone